Introduction to using the KiwiSDR
The KiwiSDR is a software-defined radio that attaches to a Seeed BeagleBone Green (BBG) embedded computer. It is available as the board alone or a more complete version including BBG, GPS antenna and enclosure with the software pre-installed on the BBG.
The Kiwi is different from other SDRs. It is a standalone device that attaches to your local network and is optionally accessed through the Internet. A browser is used to connect to the user interface. Most other SDRs generate raw IQ data and need to be connected directly to a PC or laptop running OS-specific, installed software.
Browsers supported include Firefox, Chrome, Safari and Opera on Windows, Linux and Mac. A version of the interface for mobile devices is under development. Until then the browser interface will work on iPad and Android devices with a large enough display. The Kiwi supports up to four simultaneous connections each with their own independently controlled audio and waterfall channels. An extension interface allows advanced signal decoding directly in the browser interface without installing additional software. The most popular is the integrated WSPR decoder and Time Difference of Arrival (TDoA) signal direction finder. The Kiwi also includes a software-defined GPS receiver used to calibrate the SDR frequency and obtainin time-of-day.
You can access over three hundred KiwiSDRs right now at the site
rx.kiwisdr.com
The owners of these Kiwis have made them publicly available. We hope you will join them, especially if you live in an interesting part of the world where a Kiwi is not yet located
(see map).
The content of these pages are not open source and may not be used elsewhere without permission.
Here's how you would typically use a Kiwi. In the images below a yellow arrow will show the buttons and menus to click.
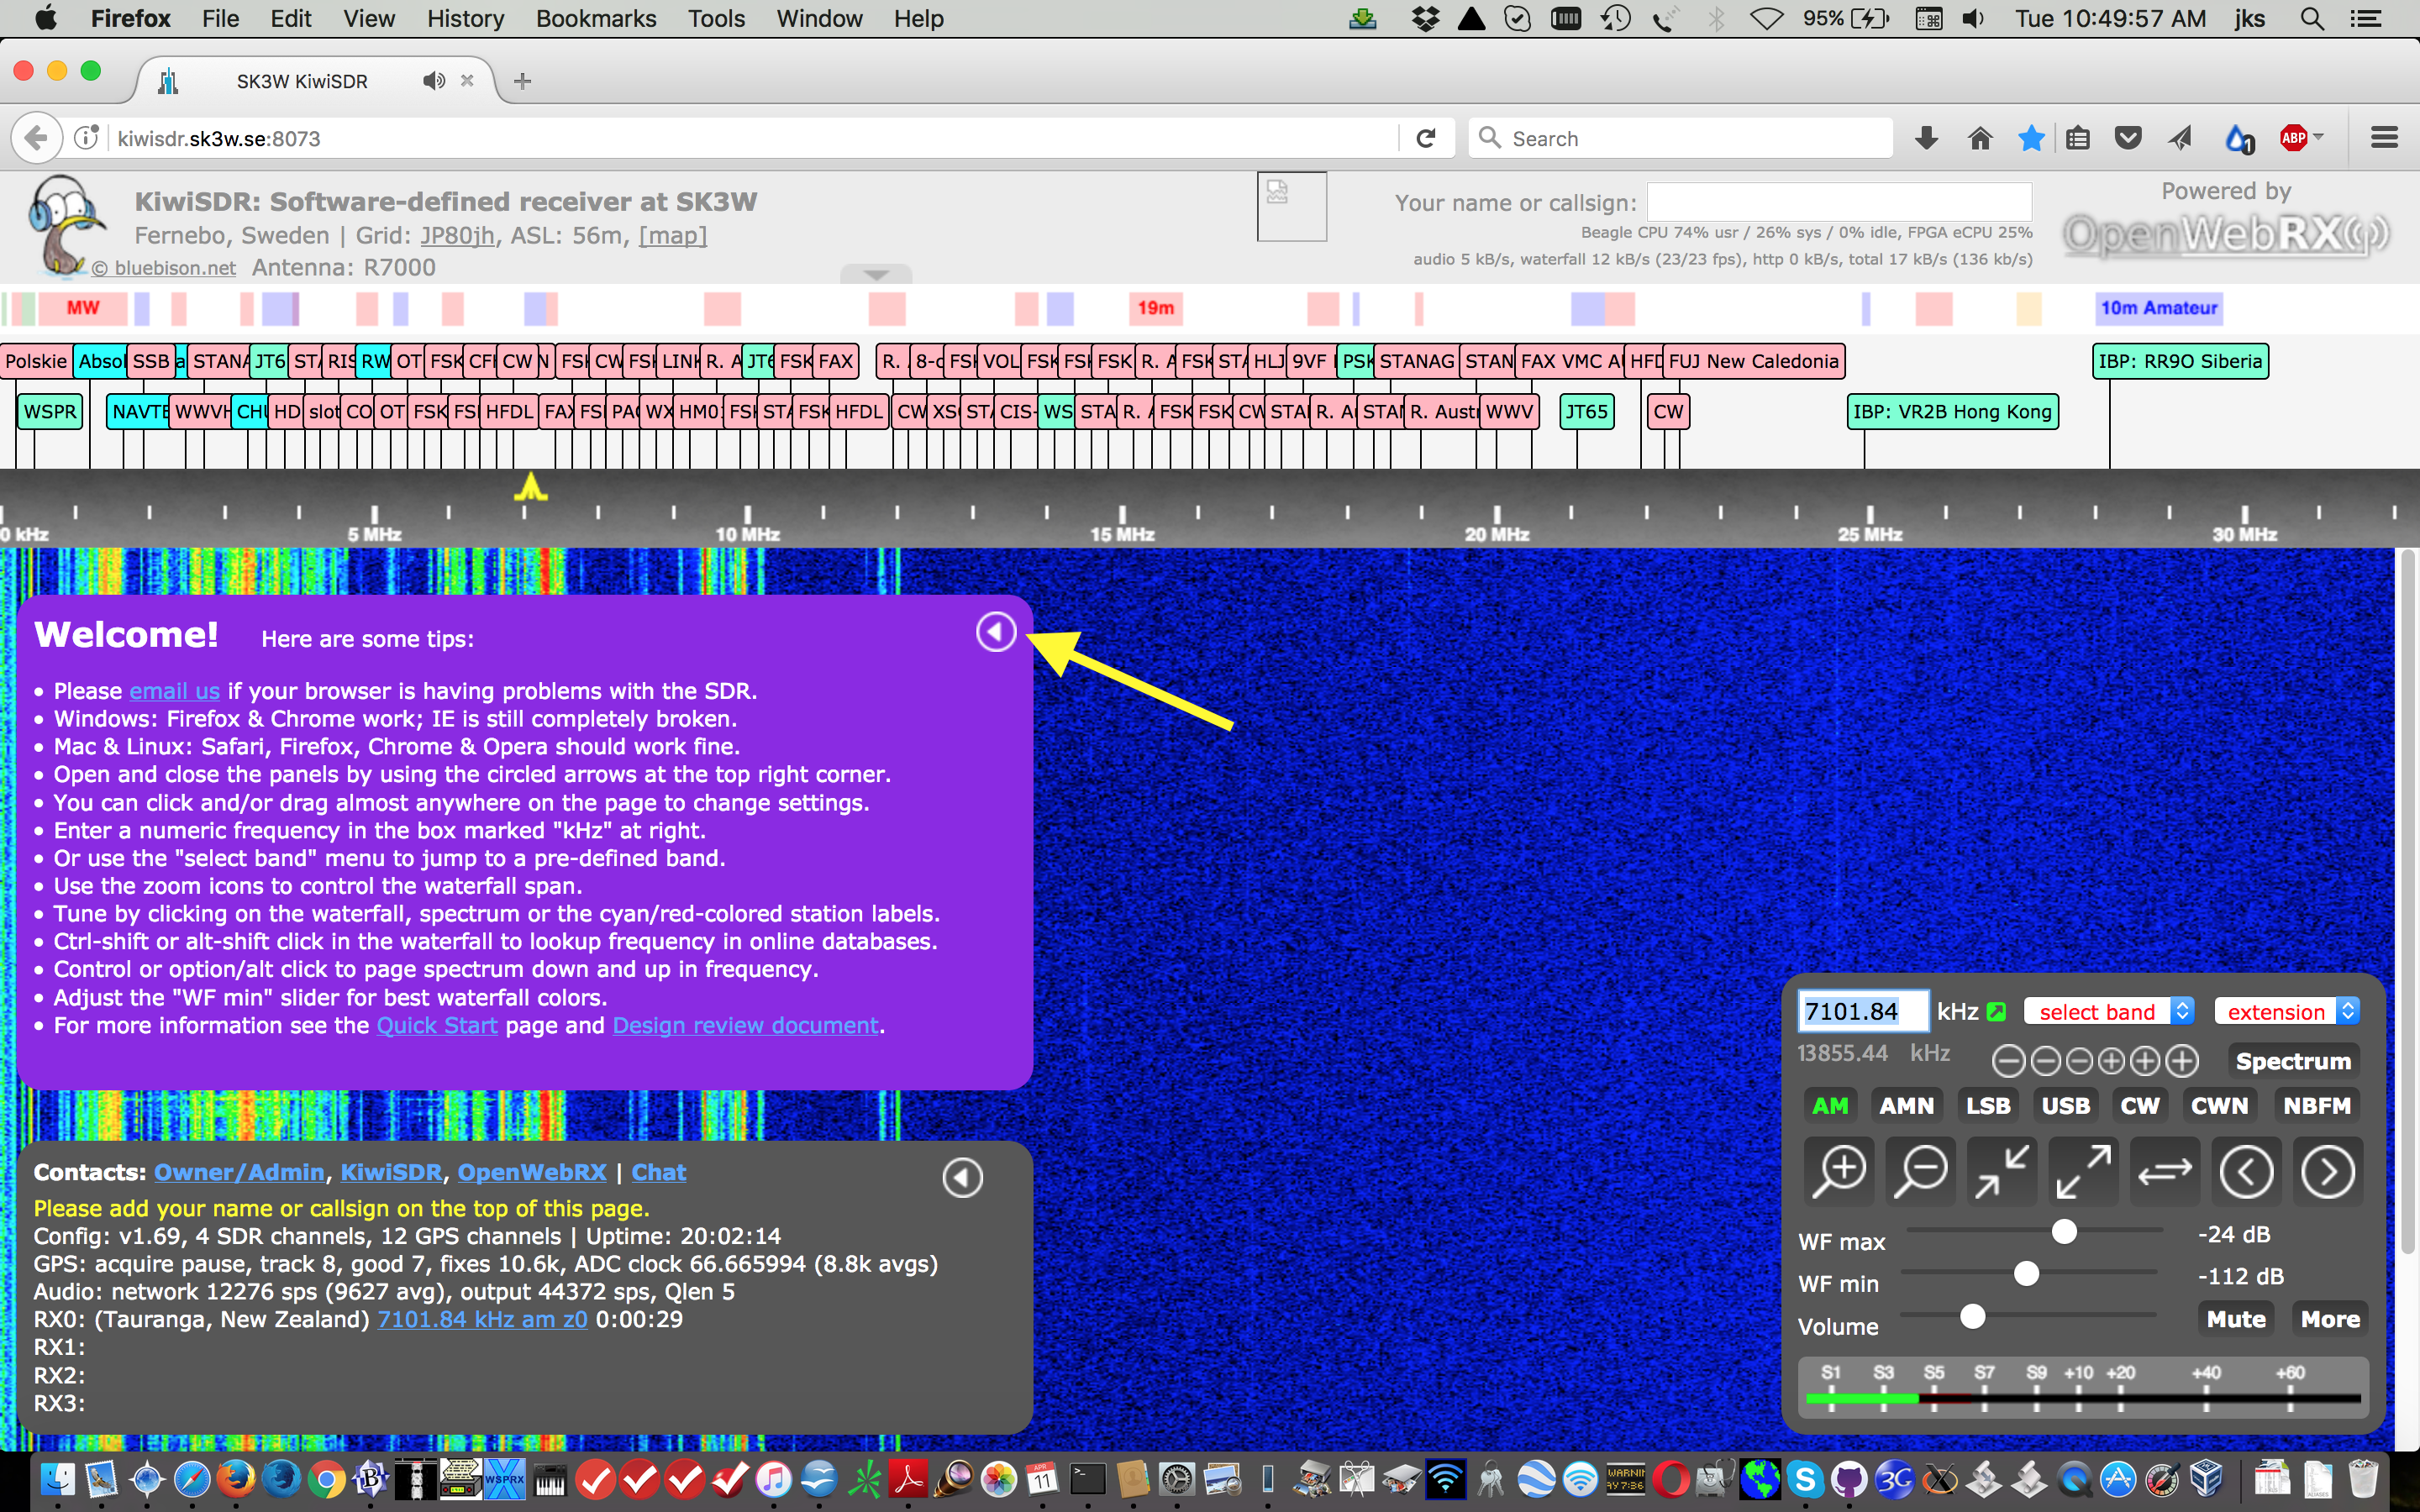
Start by accessing a public Kiwi at rx.kiwisdr.com or one attached to your local network (e.g. my.kiwisdr.com or kiwisdr.local:8073) You should see a webpage similar to the one below. Here we're using the SK3W Contest Station in Sweden. When you've read the "Welcome" message hide it by clicking on the circled arrow at the top right of the purple panel.
Note the waterfall display with a dark blue background. The grey frequency scale above it shows a range of 0 to 30 MHz. There are few signals showing above 12 MHz because it was nighttime at SK3W when this image was taken and those signals are attenuated. The waterfall has 14 levels of zoom. Above the frequency scale is a collection of red and green signal labels and band range indicators. You can click on the labels to tune directly to those frequencies. The individual labels are easier to read when zoomed in. The labels can be edited by the Kiwi owner/administrator to identify signals heard locally.
At lower right is the control panel. Here you will find all the major controls: numeric receive frequency, reception mode (AM, USB, CW, etc.), the waterfall zoom controls (+/- magnifying glasses, max in/out arrows) and adjustments of the waterfall color map (WF max/min). Also shown is an S-meter.
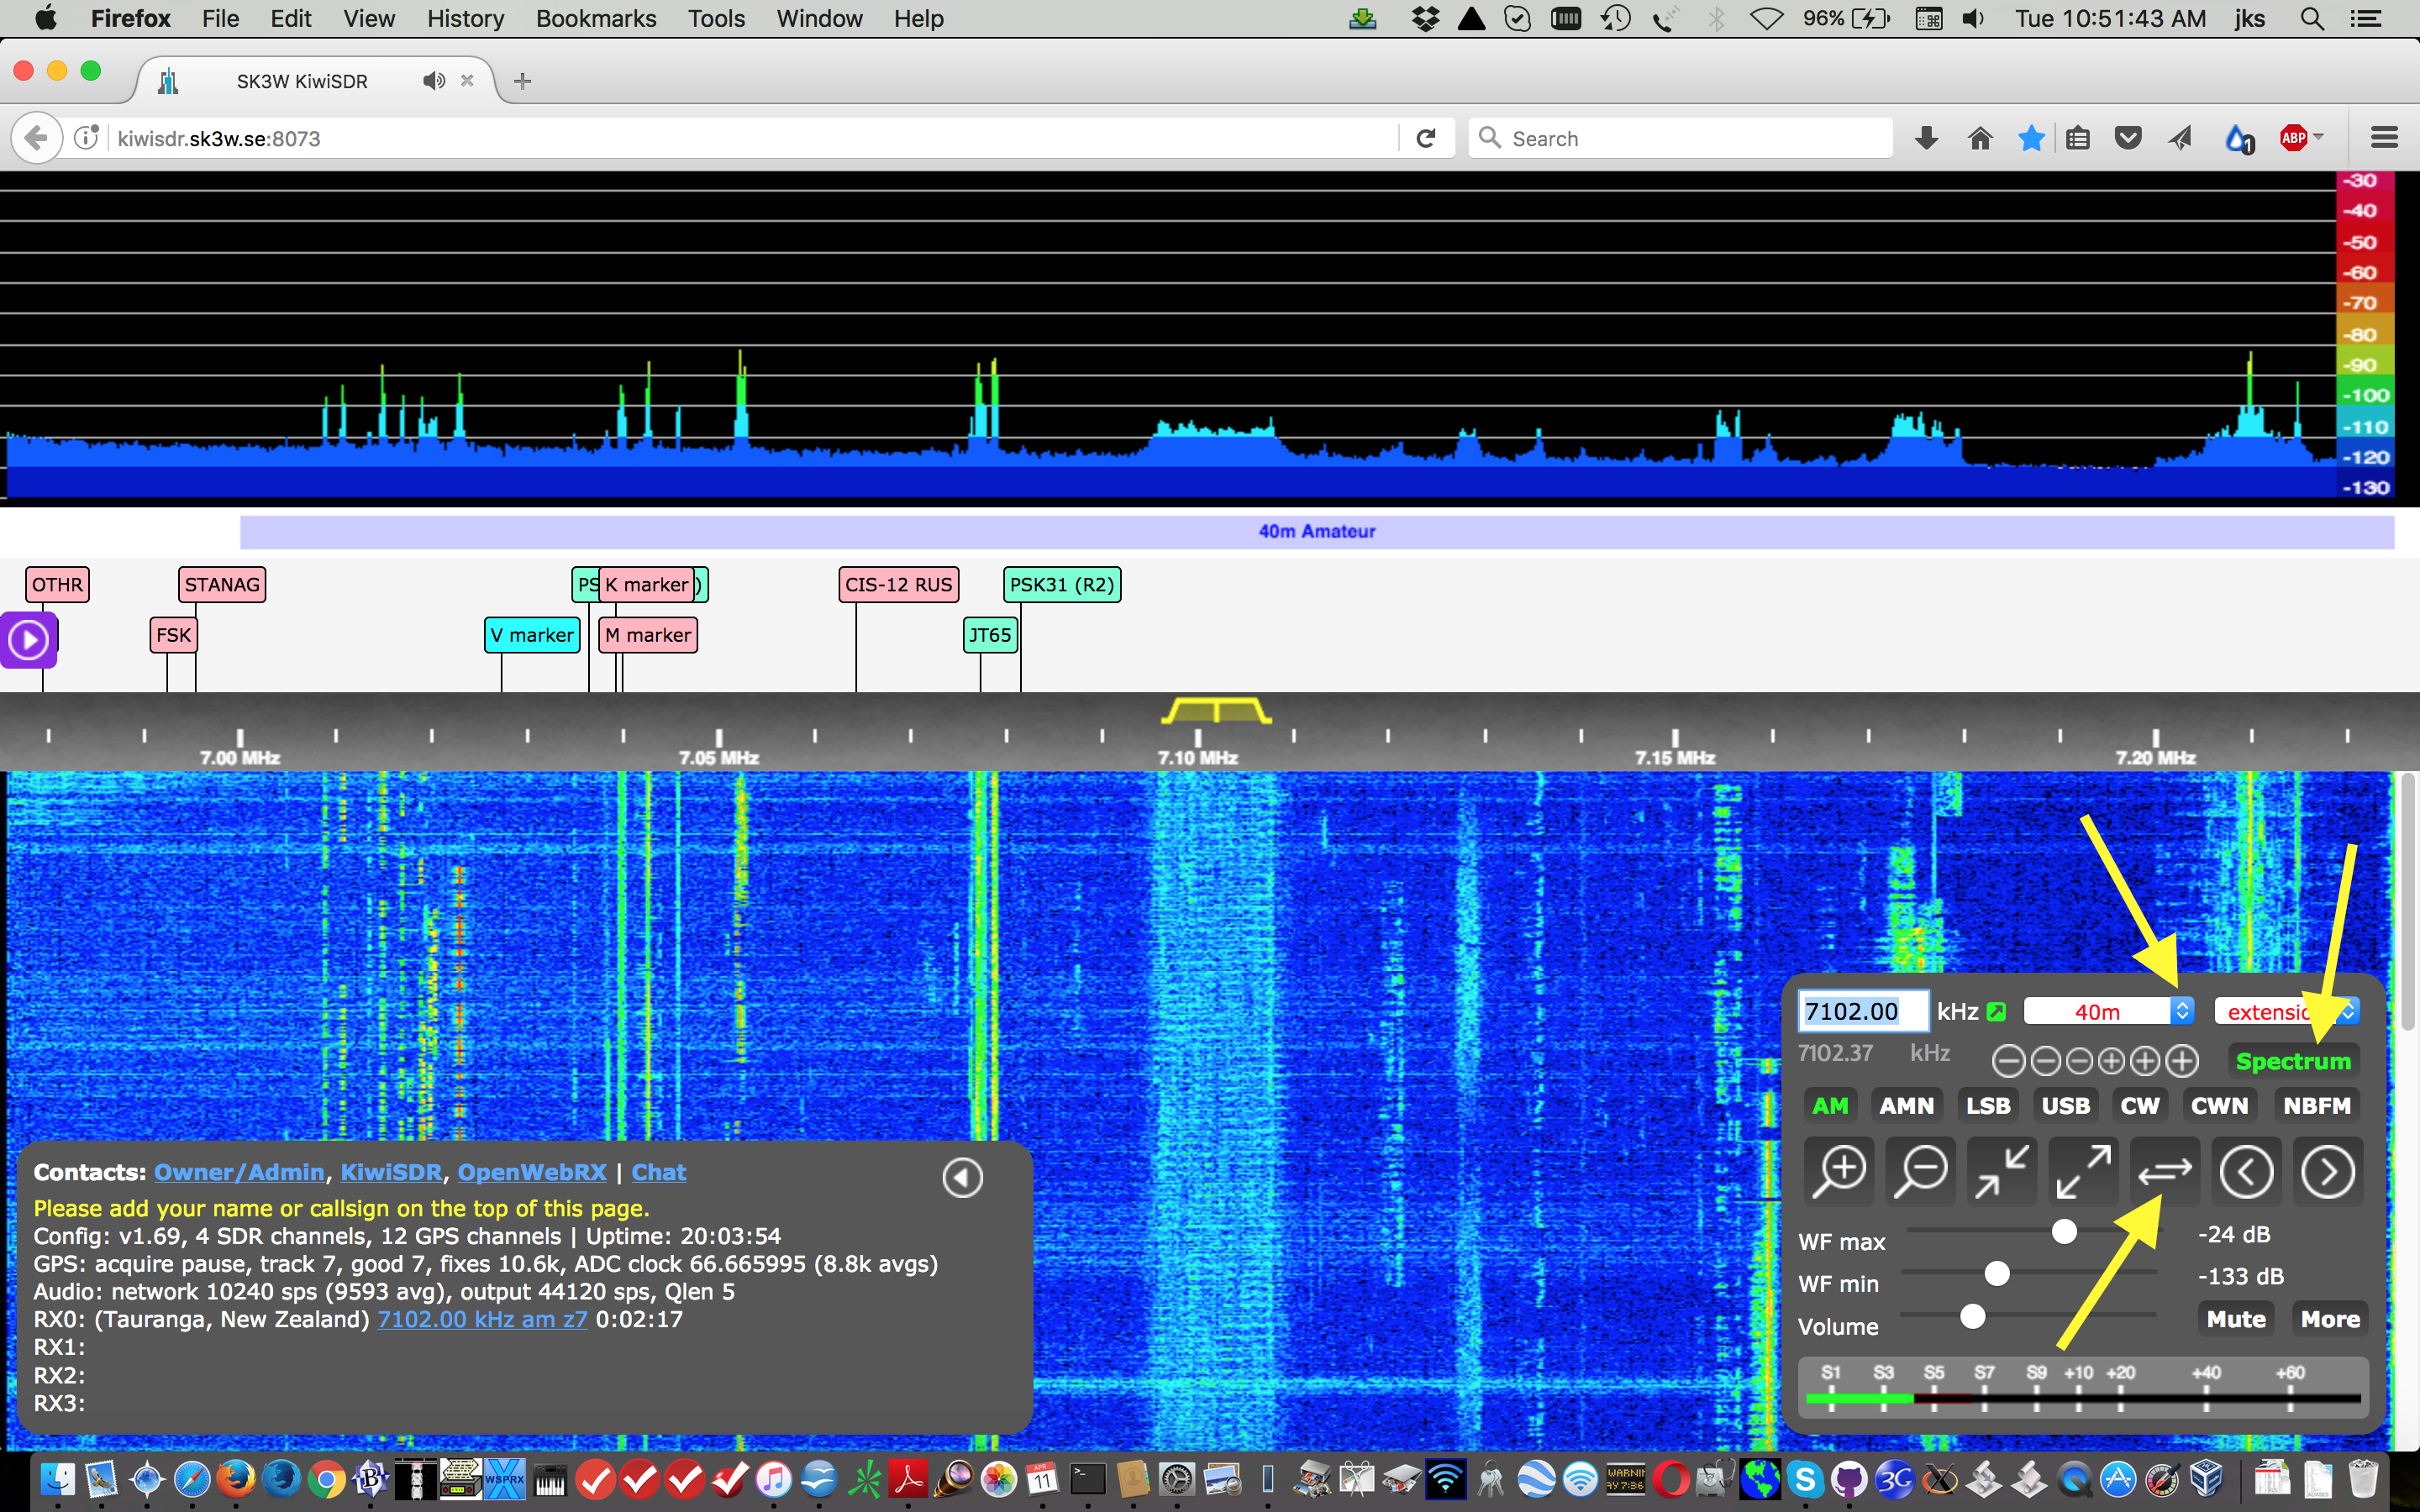
Now let's zoom into the 40 meter Amateur radio band for a closer look. On the "select band" menu select the entry under "Amateur" that says "40m". The waterfall has now zoomed in much closer and signals are easier to see. Click the button with the left/right arrows to zoom in a little further. The click the button marked "Spectrum". The top banner will be replaced with a spectrum display showing signal strength for each waterfall signal.
There are several ways to tune around. You can click in the waterfall, spectrum or label area. Note how the yellow passband in the frequency scale follows and the numeric frequency in the control panel updates. You can also click-drag in the frequency scale and the passband will tune smoothly. The six -/+ buttons in the control panel adjust the frequency in controlled steps. When the mouse hovers over a button the step amount is shown.
There are many more ways to interact with the interface. Experiment and see what you find. For example, click-dragging in the waterfall scrolls without altering the received frequency. Complete documentation is here.
The Kiwi allows software "extensions" selected by the menu at top right of the control panel. It is certainly possible to route the Kiwi audio output from the browser, through a "virtual audio cable" application, and into traditional digital-mode signal processing programs (e.g. MultiPSK, Fldigi, etc.) But we wanted to test the idea of integrating specialized signal decoders directly into the browser-based interface. Without the need to install additional programs on your computer. Current extensions are: signal strength graph, signal integrator, IQ display, Loran-C display and WSPR decoder. More are in development.
The most popular is the WSPR decoder. As shown below a WSPR-specific waterfall and control panel will appear. We've pushed the 40m band button to start the decoding. The pie-shaped blue/white icon is the two minute WSPR acquisition timer. The station spot list will be familiar to anyone who has used tradition WSPR decoding programs. You can click on the callsign or grid location of the received stations. The station distance from the Kiwi is computed. If the Kiwi admin has set a reporter callsign and grid location the decoded spots will be uploaded to wsprnet.org.

The Kiwi website has complete operation and installation information and a FAQ.
In addition to the web interface for Kiwi listeners there is a webpage based administrative interface for the Kiwi owner (kiwisdr.local:8073/admin). This is used to configure all aspects of the Kiwi setup. Including what to display in the top banner fields, rx.kiwisdr.com registration information, network configuration, GPS receiver status and access passwords.
Each day the Kiwi will automatically download and install any new software updates found on the Github project site (unless configured not to). Bug fixes and new features are being released frequently. There is an active user community that has supplied software improvements and suggestions: forum